Kanvas: IR case management that works with your spreadsheet (SOD)

The spreadsheet never went away in IR. It just grew a pile of workarounds around it. Kanvas replaces the workarounds – timelines, network graphs, one-click reports and more – without replacing the spreadsheet.
How Kanvas Solves the SOD Problem
The Spreadsheet of Doom (SOD) is a structured spreadsheet that Incident Response teams have used for over a decade to run active investigations. Tabs for scoped assets, evidence, IOCs, timelines and ATT&CK mapping, all in one file. It survived this long for one reason: it works without anything extra. Every analyst, Incident Response lead and CISO can open it on any machine and immediately understand what’s happening. Purpose-built IR platforms with custom databases and web UIs have come and gone. The SOD is still here.

The SOD holds all the right data. But getting that data out of the SOD and visualising an incident timeline, lateral movement, or a debrief report requires a significant amount of analyst time and every one of those handoffs is a source of friction, errors, and delays.
Why Kanvas does not try to replace the SOD
The SOD outlasted every tool built to replace it. It will outlast the next ones too. Kanvas (open-source) doesn’t fight that. It treats the SOD as what it already is – the source of truth – and builds everything missing on top of it. Automated timelines. One-click network graphs. Reports that take minutes, not hours. No new infrastructure. No migration. Just the file format that already works, with the capabilities it was always missing. For IR teams who want tighter operational workflows without introducing new infrastructure risk, and who want to keep using the file format that has worked for a decade – Kanvas is the missing layer.

There are great commercial and open-source case-management tools out there, but in practice many open-source projects eventually get dropped. When that happens, your data is locked into an application-specific format. Excel does not have that problem. The design principle was simple: define what any new tool absolutely had to avoid, and what it had to achieve. That brief is what makes Kanvas different from every previous attempt.

The core of Kanvas tool is a spreadsheet, a few Markdown files and YAML config. No extra infrastructure, no complicated setup. It runs on Windows, macOS, and Linux. Download it, open it, start working. The architecture is deliberately minimal. Case files are fully portable. Hand one to a colleague and they can open the .xlsx in any spreadsheet application without Kanvas installed. The tool adds workflow capability on top of universally readable, durable data formats.

What if we could use the same Excel-based approach for IR case management – with a UI that makes it easier to manage spreadsheets, handle workflows and note-taking – all without switching between multiple tools?
Kanvas is built in Python/Qt and works as a standalone desktop app. Download the release for your platform, point it at an existing SOD or start a new case everything works out of the box.
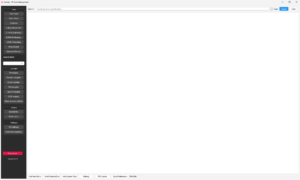
Custom SOD templates are supported as long as the expected column structure is present (as shown below). The full schema spec and compatible templates are on the GitHub page.

Below are some of the key features that make Kanvas worth trying. Head over to the GitHub page for the complete picture.

Incident timeline: Building an incident timeline manually from a spreadsheet is one of those tasks that sounds simple until you’re three hours deep, moving rows around and second-guessing the chronology. Kanvas generates the timeline automatically from the SOD. It pulls only the relevant events rather than dumping every row, segments them by day so the attack progression reads clearly and lets you export to PNG or CSV in a single click – ready for a client report or debrief deck without any extra formatting work.

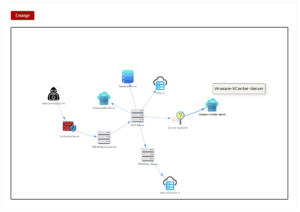
Lateral movement: Describing a complex lateral movement chain without a visual is a hard sell – for the analyst writing the report and the client trying to understand what happened on their network. Kanvas generates the network graph automatically from the SOD. System types get matched to icons, so the diagram is readable at a glance, and the whole thing exports in one click – ready to drop into a report or a debrief slide.
MITRE ATT&CK Flow builder: Attack Flow (MITRE Project) lets you map the sequence of adversary actions observed during an incident. Kanvas lets you build these flows directly from the case, add context around each TTP, and draw the connections that tell the full attack story. The output is interactive and embeddable for sharing threat intel, and exports as an image.

Reporting: The report output is a single self-contained HTML file. Every image is Base64-encoded and embedded directly – no separate assets. Share it, archive it, or open it offline. One file is all you need. File size scales with the number of images in your recommendations and investigation summary.

Kanvas takes three inputs to generate a report: the SOD file, an optional recommendations file, and an optional investigation summary file. Both optional files are Markdown-based – the recommendations file is reusable across multiple investigations, saving time on repeat engagement types. From there, the report UI lets you choose and customise what gets included.

Quick Reference: Having the right reference material at hand during an investigation saves time when it matters most. Kanvas Quick Reference pulls from well-known open-source datasets and GitHub projects, surfacing them directly inside the tool. When the upstream projects update, the data gets pulled into the Kanvas repository, keeping the references current. Projects currently supported are:

Here is a quick summary of what Kanvas offers for incident response case management.

How Kanvas Solves the SOD Problem
The next major addition is the Analysis Module.
During an IR engagement, analysts regularly encounter high-volume log sources beyond standard forensic artefacts – Windows Event Logs, firewall logs, DNS exports, and more – often in CSV, JSON, or plain text format. Getting useful signal out of those files typically means standing up infrastructure like OpenSearch or Elasticsearch, which takes time.
The Analysis Module removes that dependency. Large log files are converted to Parquet format, which reduces file size by 10x to 50x. Those files can then be queried locally using DuckDB – SQL directly against the data, no server required, no additional infrastructure, and the files stay in their original format throughout. It is a practical addition and we expect to ship it in a future Kanvas release.

If you are using Claude Code for log analysis and surface interesting timeline events, you can instruct Claude Code directly to update the SOD file in the correct column format. This keeps the SOD as the single source of truth – no manual entry, no copy-paste between tools. Once the data is in the SOD, every Kanvas workflow picks it up automatically: timeline visualisation, lateral movement graph, ATT&CK mapping, and one-click reporting all reflect the updated case data without any additional steps.